Introduction to InfluxDB
Table of contents
What is InfluxDB
InfluxData is the company behind InfluxDB and Telegraf.
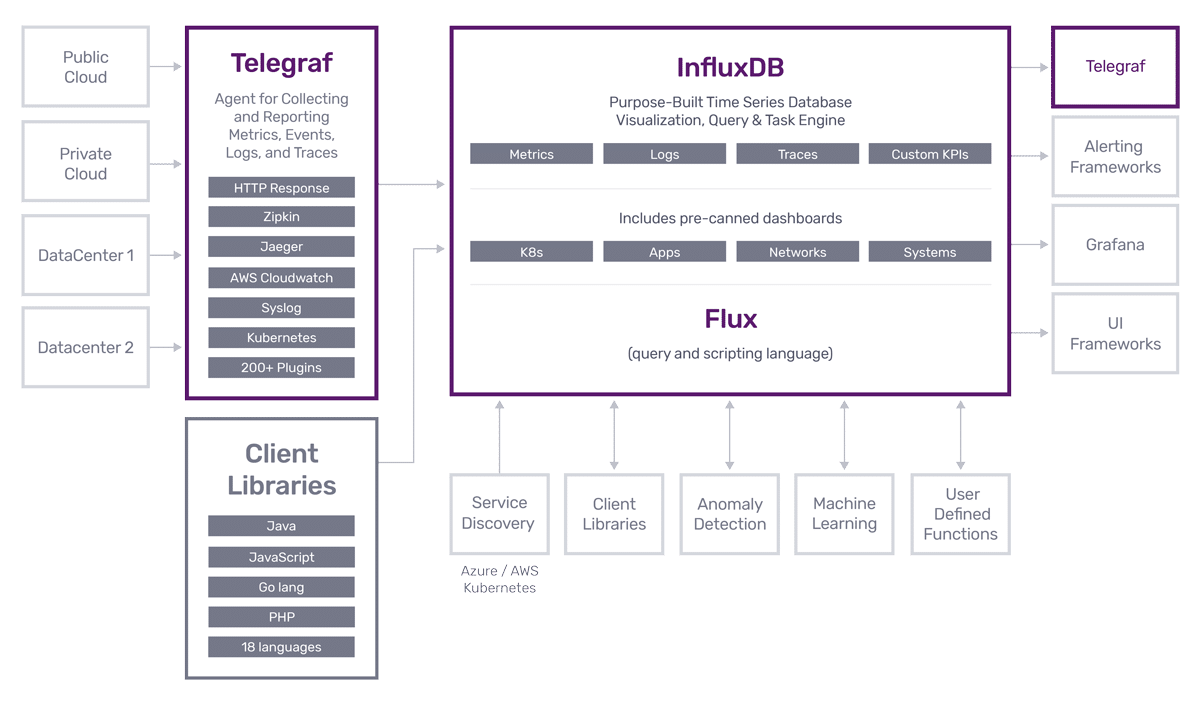
InfluxDB, released in 2013, is the best time series database available for storing metrics and sensing data. It has since evolved into a full blown time series application development platform used by thousands of developers to create; customer facing IoT, server monitoring, financial applications, bespoke monitoring applications for thousands of servers and devices, and many many other applications. Take a look at various case studies and customer testimonials from IBM, Adobe, Hulu, Cisco and more. InfluxDB is more than the leading time series database. InfluxDB also includes the InfluxDB User Interface (InfluxDB UI) and Flux. The InfluxDB UI is a time series management, visualization, and dashboarding tool. It also offers a script editor for Flux. Flux is a functional scripting and query language that enables data processing tasks like sophisticated data transformation and alerting.
Telegraf is the open source server agent for collecting metrics and events. Telegraf is plugin driven and compiles into a single binary. There is a huge collection of input, output, aggregator, and parser plugins that enable developers to collect data, apply transformations to it, and write it to the destination datastore of their choice.
The InfluxDB Advantage
Paul Dix, founder and CTO of InfluxData, frames decision making around the concept of minimizing “time to awesome” or the hurdle to adoption and value. The developer experience is our priority at InfluxData.
If you are thinking about creating an application related to time stamped data (IoT, Sensor Monitoring, Server Monitoring, Finance, etc…), InfluxDB is the easiest and most powerful development platform for you. This book will show you why that’s true.
Time to Awesome
You can choose between downloading and running the Open Source (OSS) version or creating a free account in InfluxDB Cloud and letting us run it for you.
The OSS version comes as a single binary, so you can just download it and run it. There are also packages for popular Linux distributions. You can also sign up for a free cloud account which is just as easy as “click, click, authenticate your email, and get going”. Either way, getting up and running with InfluxDB literally takes a couple of minutes.
Finally, when it comes to choosing between the OSS version of InfluxDB cloud, either choice is the right choice because we put a lot of effort into keeping the API’s consistent and compatible across our two offerings. So if you need, you can always switch over to the other later.
Write and Query sample data
The fastest way to write data into InfluxDB is to write some sample data with the script editor in the InfluxDB UI. Writing a sample dataset is a great way to get some meaningful data into the platform to get a feel for InfluxDB. You can pick whichever sample dataset you want to use, but we’ll use the NOAA water sample data in this section.
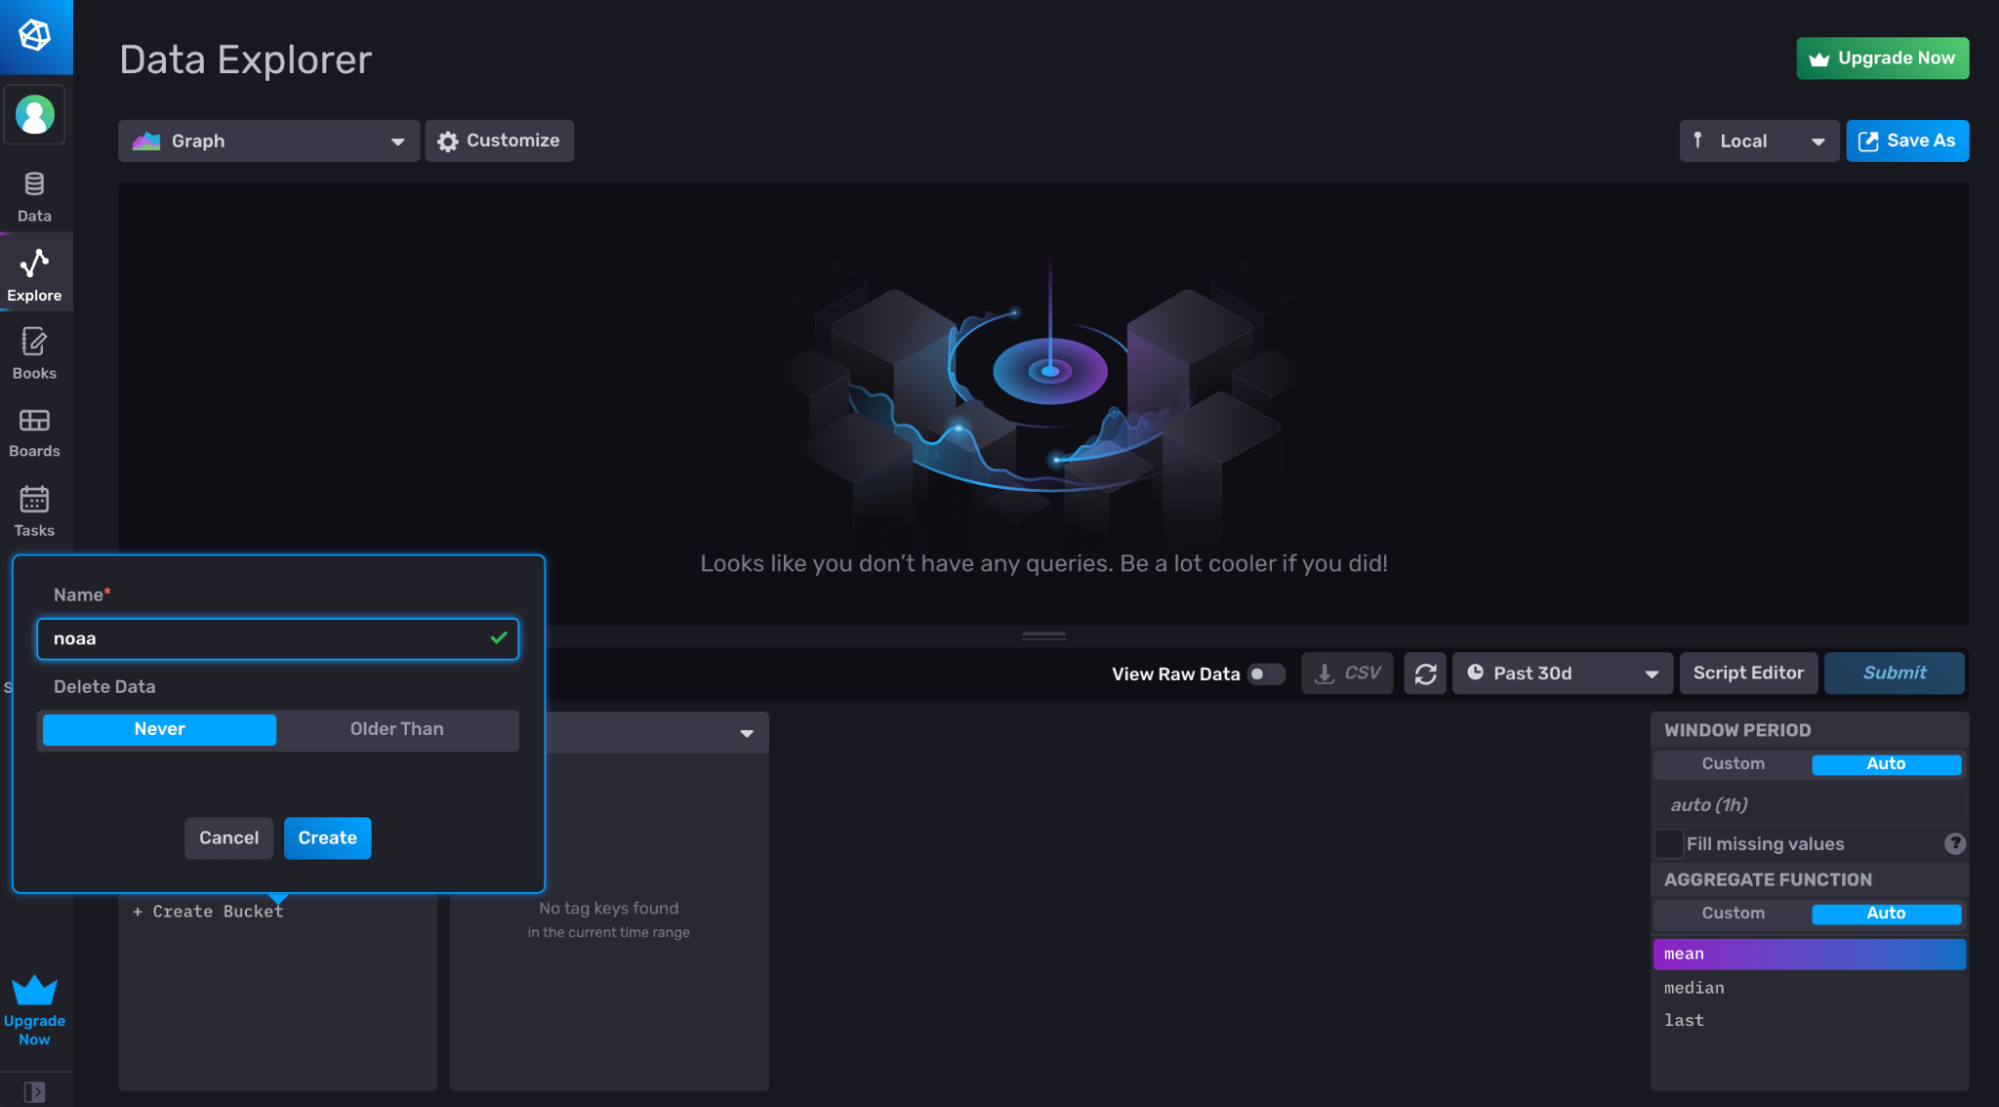
After setting up InfluxDB, navigate to the Explorer page and click the + Create Bucket button. Name your bucket “noaa”. A bucket is a named location where you store your data in InfluxDB.
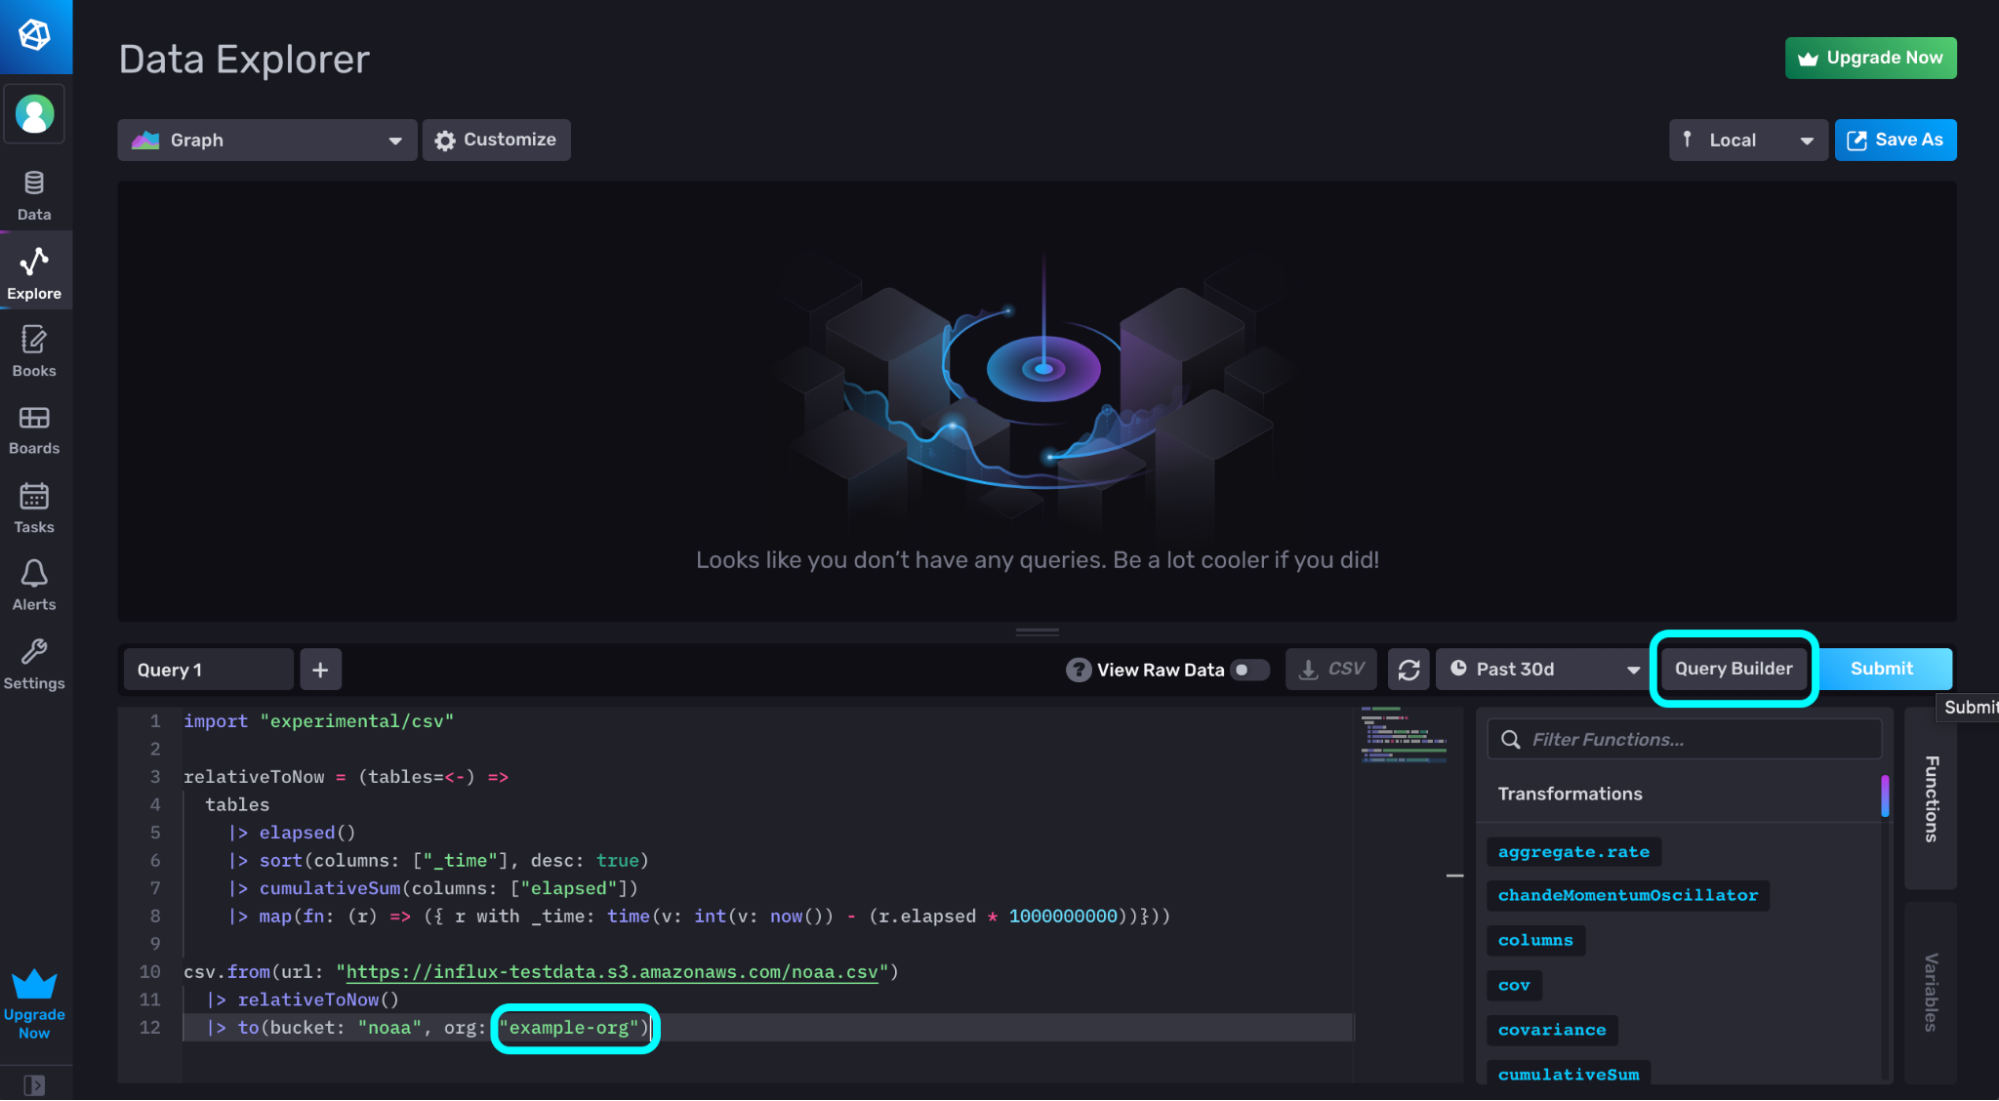
Now navigate to the Script Editor and copy and paste the following Flux code from the documentation. You don’t have to understand this code right now, the only part to pay attention to is the to() function in the last line.
import "experimental/csv"
relativeToNow = (tables=<-) =>
tables
|> elapsed()
|> sort(columns: ["_time"], desc: true)
|> cumulativeSum(columns: ["elapsed"])
|> map(fn: (r) => ({ r with _time: time(v: int(v: now()) - (r.elapsed * 1000000000))}))
csv.from(url: "https://influx-testdata.s3.amazonaws.com/noaa.csv")
|> relativeToNow()
|> to(bucket: "noaa", org: "example-org")
Make sure to change the following parameters in the to() function:
- The bucket you want to write the NOAA sample dataset to (if you created a “noaa” bucket already, then ignore this step).
- The org to the email you used to register for a Cloud account or set up your OSS instance.
Finally, hit Submit.
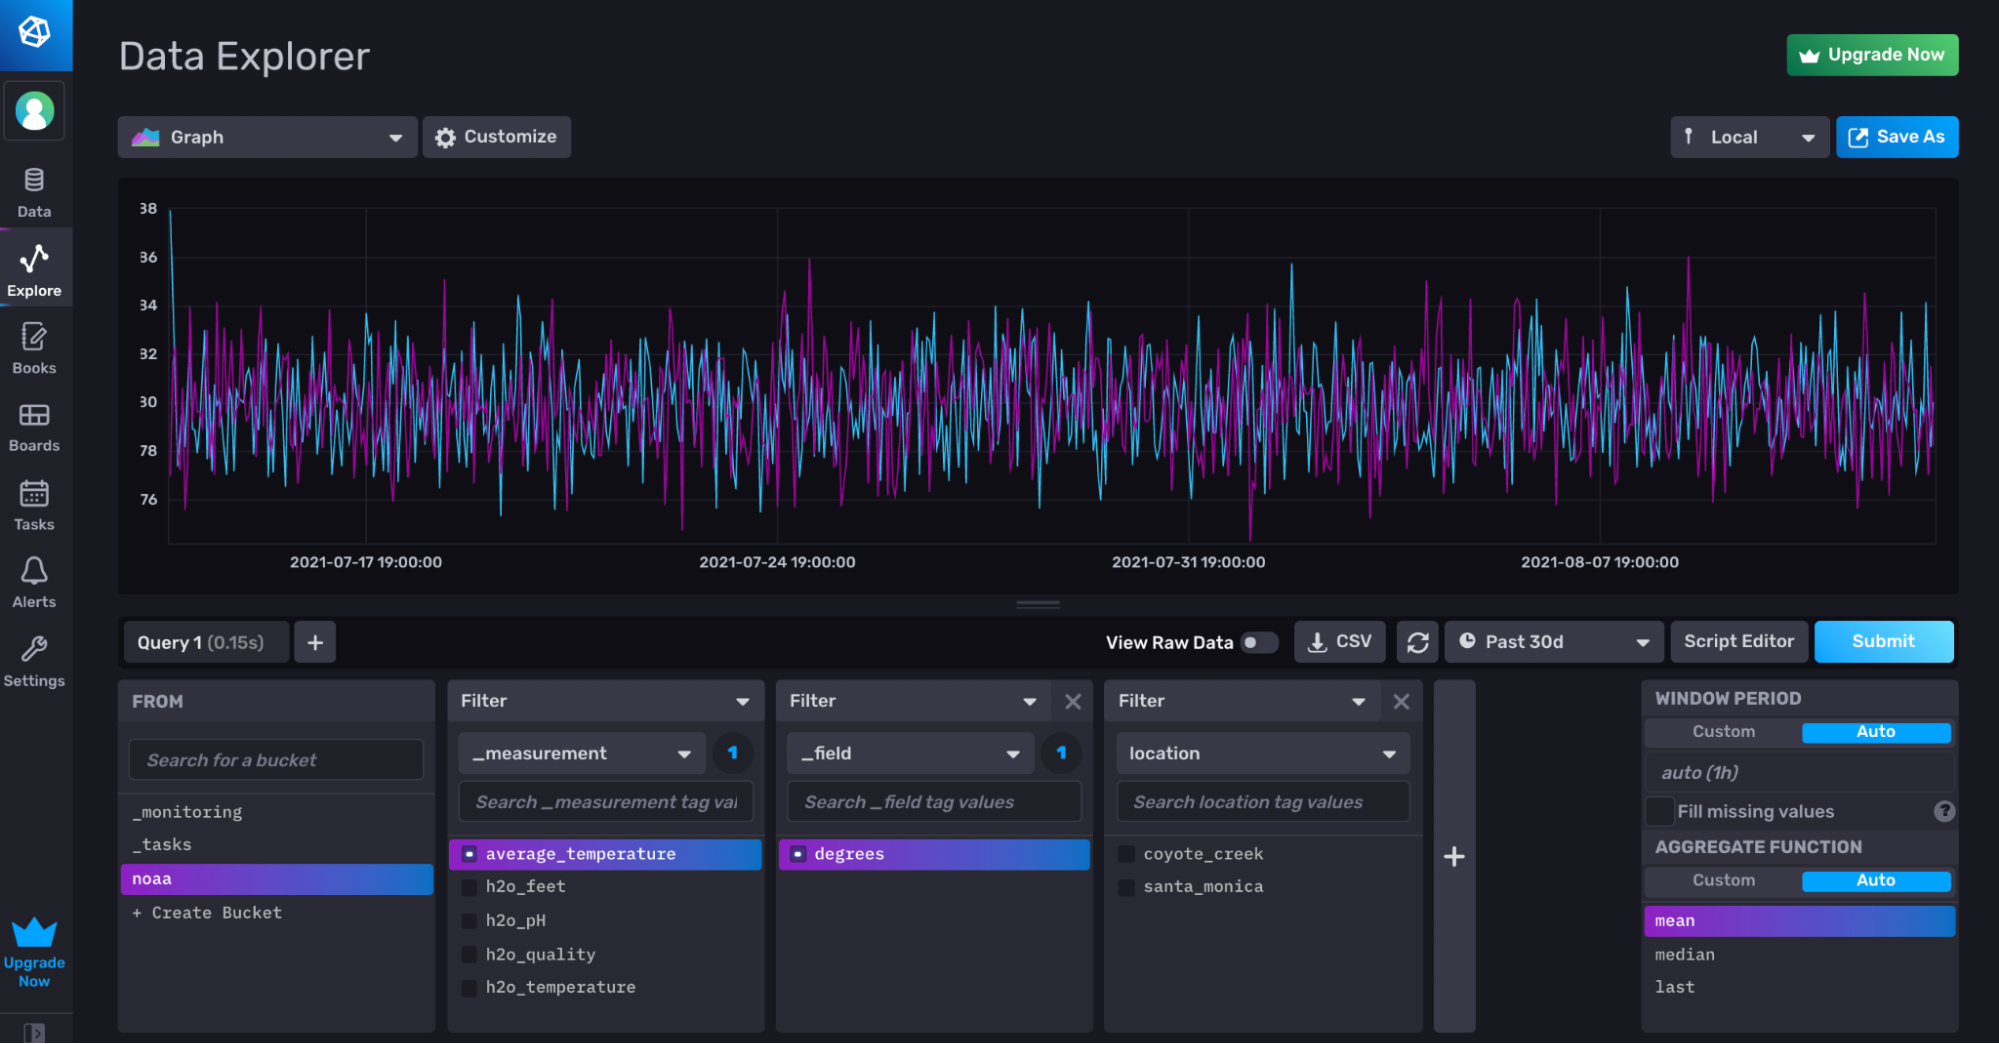
Easily query your data through the UI by using the Query Builder. Simply select the data you want to visualize and hit Submit.
Further Reading
- Getting Started with InfluxDB Cloud
- Sample Datasets
- Query Data in InfluxDB
- Write Data to Sources
- TL;DR InfluxDB Tech Tips — the Easiest Way to Use and Create InfluxDB Templates
- InfluxDB Community Templates
- https://influxdb.org.cn/blog/running-influxdb-2-0-and-telegraf-using-docker/